name: inverse layout: true class: center, middle, inverse <div class="my-header"><span> <a href="/training-material/topics/epigenetics" title="Return to topic page" ><i class="fa fa-level-up" aria-hidden="true"></i></a> <a href="https://github.com/galaxyproject/training-material/edit/main/topics/epigenetics/tutorials/introduction-chip-seq/slides.html"><i class="fa fa-pencil" aria-hidden="true"></i></a> </span></div> <div class="my-footer"><span> <img src="/training-material/assets/images/GTN-60px.png" alt="Galaxy Training Network" style="height: 40px;"/> </span></div> --- <img src="/training-material/assets/images/GTNLogo1000.png" alt="Galaxy Training Network" class="cover-logo"/> <br/> <br/> # Introduction to ChIP-Seq data analysis <br/> <br/> <div markdown="0"> <div class="contributors-line"> <ul class="text-list"> <li> <a href="/training-material/hall-of-fame/bebatut/" class="contributor-badge contributor-bebatut"><img src="/training-material/assets/images/orcid.png" alt="orcid logo" width="36" height="36"/><img src="https://avatars.githubusercontent.com/bebatut?s=36" alt="Bérénice Batut avatar" width="36" class="avatar" /> Bérénice Batut</a></li> </ul> </div> </div> <!-- modified date --> <div class="footnote" style="bottom: 8em;"> <i class="far fa-calendar" aria-hidden="true"></i><span class="visually-hidden">last_modification</span> Updated: <i class="fas fa-fingerprint" aria-hidden="true"></i><span class="visually-hidden">purl</span><abbr title="Persistent URL">PURL</abbr>: <a href="https://gxy.io/GTN:S00059">gxy.io/GTN:S00059</a> </div> <!-- other slide formats (video and plain-text) --> <div class="footnote" style="bottom: 5em;"> <i class="fas fa-file-alt" aria-hidden="true"></i><span class="visually-hidden">text-document</span><a href="slides-plain.html"> Plain-text slides</a> | </div> <!-- usage tips --> <div class="footnote" style="bottom: 2em;"> <strong>Tip: </strong>press <kbd>P</kbd> to view the presenter notes | <i class="fa fa-arrows" aria-hidden="true"></i><span class="visually-hidden">arrow-keys</span> Use arrow keys to move between slides </div> ??? Presenter notes contain extra information which might be useful if you intend to use these slides for teaching. Press `P` again to switch presenter notes off Press `C` to create a new window where the same presentation will be displayed. This window is linked to the main window. Changing slides on one will cause the slide to change on the other. Useful when presenting. --- ## Requirements Before diving into this slide deck, we recommend you to have a look at: - [Introduction to Galaxy Analyses](/training-material/topics/introduction) - [Sequence analysis](/training-material/topics/sequence-analysis) - Quality Control: [<i class="fab fa-slideshare" aria-hidden="true"></i><span class="visually-hidden">slides</span> slides](/training-material/topics/sequence-analysis/tutorials/quality-control/slides.html) - [<i class="fas fa-laptop" aria-hidden="true"></i><span class="visually-hidden">tutorial</span> hands-on](/training-material/topics/sequence-analysis/tutorials/quality-control/tutorial.html) - Mapping: [<i class="fab fa-slideshare" aria-hidden="true"></i><span class="visually-hidden">slides</span> slides](/training-material/topics/sequence-analysis/tutorials/mapping/slides.html) - [<i class="fas fa-laptop" aria-hidden="true"></i><span class="visually-hidden">tutorial</span> hands-on](/training-material/topics/sequence-analysis/tutorials/mapping/tutorial.html) --- # What is ChIP sequencing? --- ### Where my data comes from? 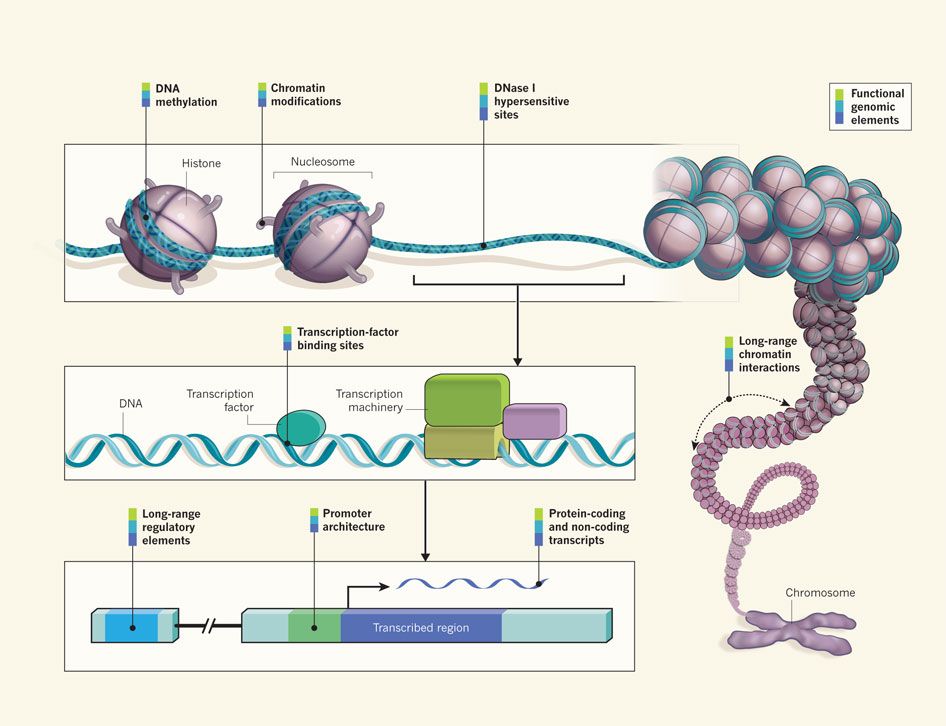 <small> [*Ecker et al, Nature, 2012*](https://www.ncbi.nlm.nih.gov/pubmed/22955614) </small> --- ### Chromatin immuno-precipitation 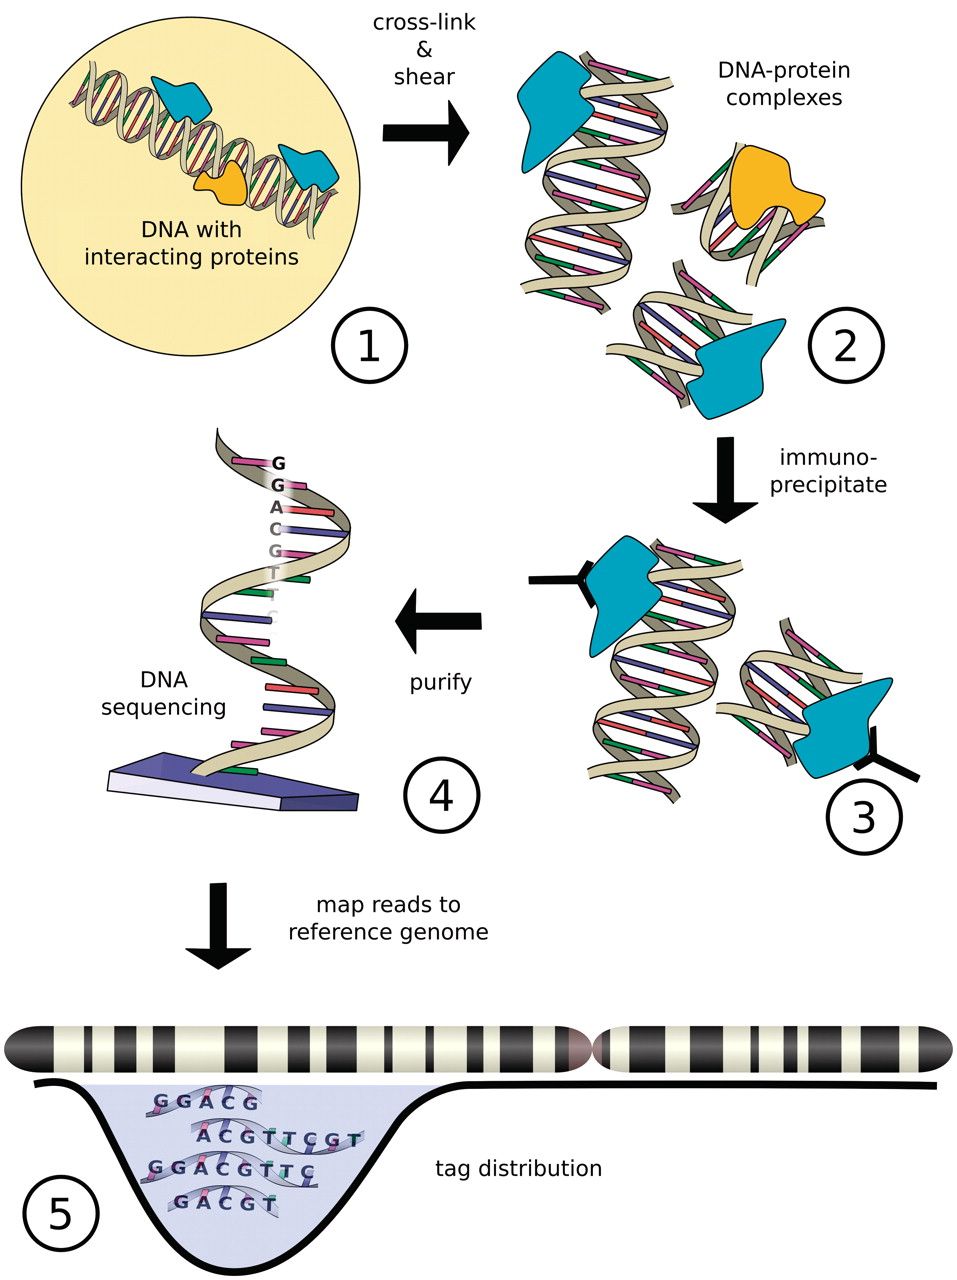 [*Szalkowski & Schmid, Brief Bioinform, 2011*](https://bib.oxfordjournals.org/content/12/6/626.long) --- ## How to analyze ChIP-seq data? --- ### Common procedures for ChIP-seq data analysis 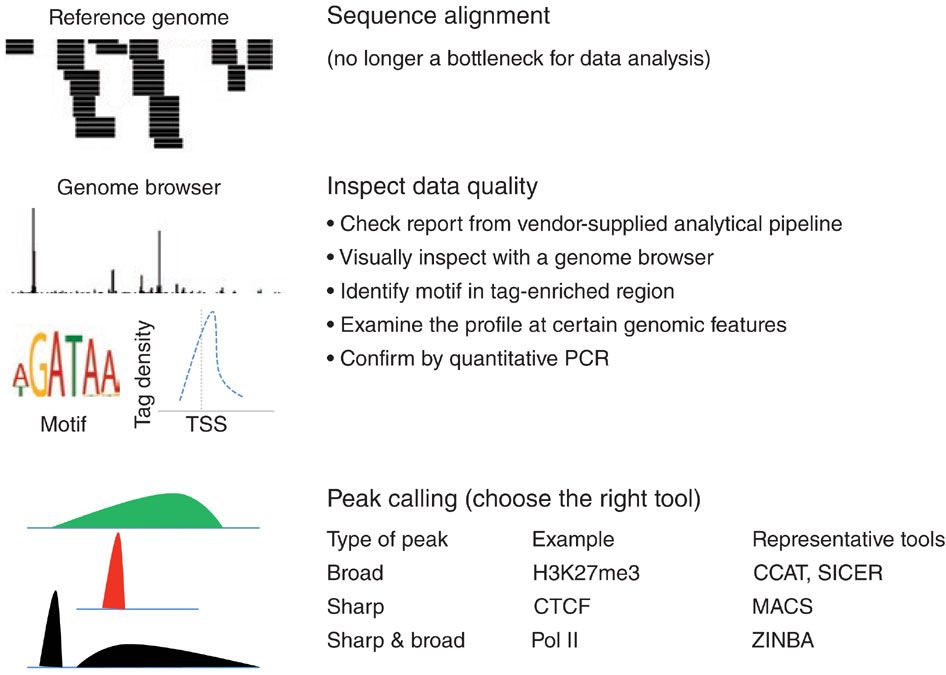 [*Kidder et al, Nature Immunology, 2011*](https://www.ncbi.nlm.nih.gov/pmc/articles/PMC3541830/) --- ## Related tutorials --- ## Thank You! This material is the result of a collaborative work. Thanks to the [Galaxy Training Network](https://training.galaxyproject.org) and all the contributors! <div markdown="0"> <div class="contributors-line"> <table class="contributions"> <tr> <td><abbr title="These people wrote the bulk of the tutorial, they may have done the analysis, built the workflow, and wrote the text themselves.">Author(s)</abbr></td> <td> <a href="/training-material/hall-of-fame/bebatut/" class="contributor-badge contributor-bebatut"><img src="/training-material/assets/images/orcid.png" alt="orcid logo" width="36" height="36"/><img src="https://avatars.githubusercontent.com/bebatut?s=36" alt="Bérénice Batut avatar" width="36" class="avatar" /> Bérénice Batut</a> </td> </tr> <tr class="reviewers"> <td><abbr title="These people reviewed this material for accuracy and correctness">Reviewers</abbr></td> <td> <a href="/training-material/hall-of-fame/shiltemann/" class="contributor-badge contributor-badge-small contributor-shiltemann"><img src="https://avatars.githubusercontent.com/shiltemann?s=36" alt="Saskia Hiltemann avatar" width="36" class="avatar" /></a><a href="/training-material/hall-of-fame/hexylena/" class="contributor-badge contributor-badge-small contributor-hexylena"><img src="https://avatars.githubusercontent.com/hexylena?s=36" alt="Helena Rasche avatar" width="36" class="avatar" /></a><a href="/training-material/hall-of-fame/bebatut/" class="contributor-badge contributor-badge-small contributor-bebatut"><img src="https://avatars.githubusercontent.com/bebatut?s=36" alt="Bérénice Batut avatar" width="36" class="avatar" /></a><a href="/training-material/hall-of-fame/gallardoalba/" class="contributor-badge contributor-badge-small contributor-gallardoalba"><img src="https://avatars.githubusercontent.com/gallardoalba?s=36" alt="Cristóbal Gallardo avatar" width="36" class="avatar" /></a><a href="/training-material/hall-of-fame/nsoranzo/" class="contributor-badge contributor-badge-small contributor-nsoranzo"><img src="https://avatars.githubusercontent.com/nsoranzo?s=36" alt="Nicola Soranzo avatar" width="36" class="avatar" /></a><a href="/training-material/hall-of-fame/willdurand/" class="contributor-badge contributor-badge-small contributor-willdurand"><img src="https://avatars.githubusercontent.com/willdurand?s=36" alt="William Durand avatar" width="36" class="avatar" /></a><a href="/training-material/hall-of-fame/bgruening/" class="contributor-badge contributor-badge-small contributor-bgruening"><img src="https://avatars.githubusercontent.com/bgruening?s=36" alt="Björn Grüning avatar" width="36" class="avatar" /></a></td> </tr> </table> </div> </div> <div style="display: flex;flex-direction: row;align-items: center;justify-content: center;"> <img src="/training-material/assets/images/GTNLogo1000.png" alt="Galaxy Training Network" style="height: 100px;"/> </div> Tutorial Content is licensed under <a rel="license" href="http://creativecommons.org/licenses/by/4.0/">Creative Commons Attribution 4.0 International License</a>.<br/>